Back Donate

Insufficient Progress:
Three Steps Forward, Two Steps Back

Since NCRP’s first report describing the state of foundation funding for immigrant and refugee groups, the world has grown more dangerous for people on the move.

Although COVID-19 slowed migration for a short time, climate disasters and deteriorating social, political, and economic conditions around the world have led more people to seek homes in new places. In the United States, right-wing politicians have continued their decades-long tactic of treating immigrants and refugees as political pawns.

Former President Donald Trump used migrants as an easy scapegoat for division, effectively zeroing the country’s refugee resettlement goals throughout his presidential term. In 2021, Customs and Border Protection officers on horseback were caught on camera using whips to drive Haitian asylum seekers away. Several Republican governors sent buses or planes misleading migrants north in a craven political stunt. And after 10 years of instability, the Supreme Court looks poised to end the Deferred Action for Childhood Arrivals (DACA) program for good, meaning more than 600,000 people who have built their lives in the United States will become vulnerable to deportation. These attacks are unfair and harmful not only to people moving across borders, but to all of us.

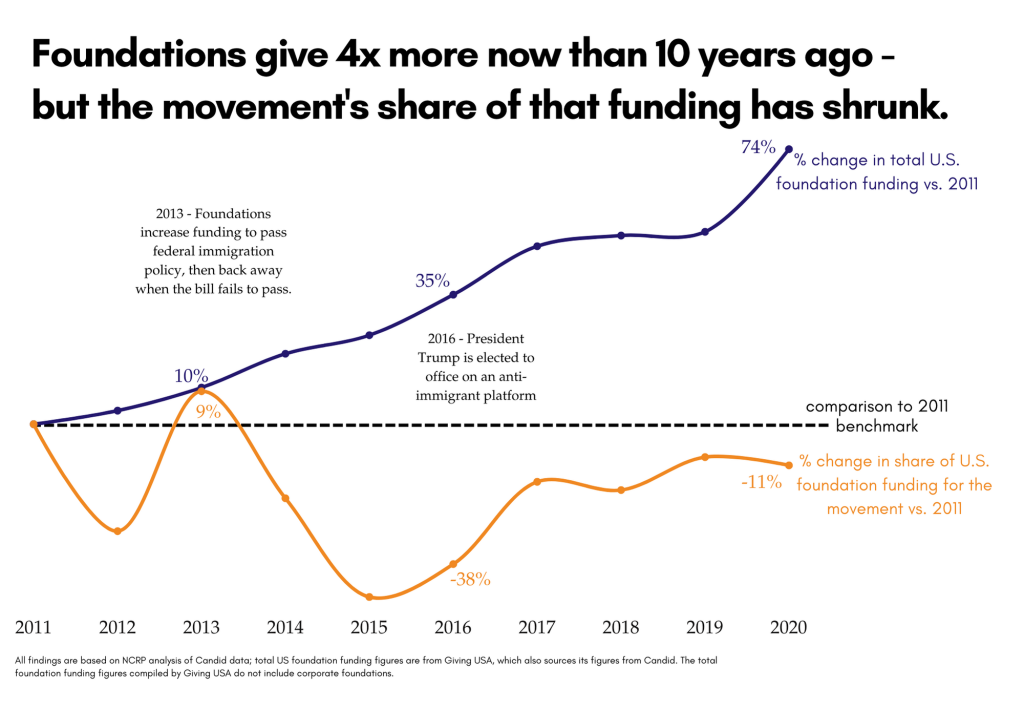
NCRP’s new data shows that more funders participate in pro-immigrant and pro-refugee philanthropic spaces today than they did in the past. This is progress, but it’s far from enough. NCRP also found that the pro-immigrant, pro-refugee movement’s share of all foundation grants has shrunk 11% since DACA was first introduced, even as foundations themselves have grown richer. Too many foundations and major donors have ignored groups that are adept at advocating for their communities and holding political leaders accountable. Because of this, the migrant community – and our country – face more precarity today.

In the last few years alone, pro-immigrant and pro-refugee groups have resettled refugees from Afghanistan and Ukraine, advocated for the specific needs of queer migrants, organized Black-led groups in a model of mutual aid, strengthened safeguards for our democracy and focused attention on urgent climate emergencies, all while sounding a constant message of welcome. Migrant organizations, especially movement advocacy groups, have done this in the face of an increasingly hostile political environment with extremely limited resources because funders have fallen short.

Now more than ever, foundations must move with intention and urgency to center, support and follow the lead of the pro-immigrant and pro-refugee movement.

This isn’t just the right thing to do. It’s also necessary if funders hope to meet their racial justice commitments, support dignity for all and reach groups with underappreciated solutions for each of their “issue” portfolios.

NCRP hopes this tool, informed by the deep wisdom of so many community and philanthropic leaders, will help move the philanthropic sector toward justice.


>> Next: Philanthropic trickle creates no-win regional competition

How Funders Forget Migrant Marginalized Identities

Within an already underfunded movement, Black, AAPI, Indigenous, refugee, and LGBTQ migrant justice groups do groundbreaking work, and their budgets deserve to be made whole.

For years, migrant communities with marginalized identities have labored to ensure that their needs are prioritized at the bargaining table. Inside an underfunded movement, these leaders answer the phone when few others can. They provide sanctuary to folks who have nowhere else to go. They build brilliant campaigns, and the movement is so much stronger for it. But philanthropy is still catching up:

Black migrant justice groups received less than 2% of all funding for the movement, 0.04% of funding explicitly granted for Black communities in general, and overall less than 0.01% of all foundation grants given during 2016-2020. It’s a missed opportunity. In centering Black communities moving across borders – especially Black women and Black trans folks – these groups lift up every person caught in the crosshairs of our broken immigration and criminal justice systems. For years, Black migrant movement leaders have called on philanthropy to trust them, echoed by sector advocates like A Philanthropic Partnership for Black Communities (ABFE) and Grantmakers Concerned with Immigrants and Refugees (GCIR), most recently with the Black Migrant Power Fund’s $10 million call to action. By funding Black migrant justice groups, funders who spoke out against anti-Black racism during the nationwide uprisings in the wake of the murder of George Floyd in 2020 have an opportunity to deepen that commitment.

In the same time frame, migrant justice groups rooted in the Asian and Pacific Islander diaspora received just 5% of the movement’s funding. This underfunding mirrors broader trends, including the fact that AAPI communities only account for 0.20% percent of all U.S. grantmaking. AAPI-led groups in the pro-immigrant and pro-refugee movement are already combatting anti-Asian violence, overcoming persistent exclusion and pushing for wins that reflect dozens of communities’ distinct needs. Philanthropy must step up too, providing data that honors the radical diversity of the diaspora and funding folks at the levels they need to thrive.

• LGBTQ migrant justice groups also received less than half a percent of the movement’s funding. While this is double the share they received 5 years earlier, it’s a small fraction. This funding was 0.6% of all funding for LGBTQ communities during this time. This too was triple the share from 5 years prior, but pennies of pennies are a hollow victory. This, too, is a shame: LGBTQ justice and migrant justice are inextricably linked. Especially as anti-immigrant and anti-trans attacks increase, LGBTQ migrant communities deserve philanthropic allies ready to back up their words with action.

• Refugee justice groups in the movement, in turn, received 15% of the movement’s funding in the last 5 years. Support from philanthropy will be crucial as refugee-led groups continue to rebuild and re-organize after the Trump administration’s decimation of government-funded resettlement agencies. As Basma Alawee from NCRP nonprofit member We Are All America noted, “when funders build, share and wield power with refugee leaders in the South like myself, progress – and systemic change – can be achieved.”

And while current foundation reporting makes calculating specific numbers difficult, philanthropy also particularly underfunds Muslim, Arab, and Middle Eastern migrant justice groups. The same is true for groups led by undocumented folks, immigrants with disabilities, and migrant communities with criminal records, which see the cracks and organize solutions at the places where our legal and moral systems fall short.

These communities obviously overlap. And immigrant communities and the pro-immigrant and pro-refugee movement deserve much more funding as a whole. But by knowing where grants have fallen short before, philanthropy can start filling this funding gap and avoid these blind spots at the same time.

The Trump Response: Short-lived & Shallow Allyship

The 2016 election was a wake-up call for funders, but not a watershed. What will it take for philanthropy to fund our communities and the pro-immigrant and pro-refugee movement at the level we deserve?

Spooked by Donald Trump’s election and his anti-immigrant attacks, foundations started to give more money to explicitly benefit immigrants and refugees after 2016. Average yearly funding for the movement more than doubled from $130 million during 2011-2015 to $280 million during 2016-2020. For those who received it, this new money was meaningful as groups faced increased pressure from all sides. Many funders also signed petitions and made public statements in solidarity, which were valuable messages that at least some in the sector stood in solidarity with this community.

Once the headlines faded, however, far fewer foundations made migrant justice a core part of their mission or an intersectional piece of their racial equity grantmaking. This may be because relatively few funders understand that the Trump administration’s violence belongs to a bigger tradition that predates him. Anti-immigrant attacks, by both government agencies and political actors, have occurred for generations in both Democratic and Republican administrations, and they persist today.

As a result, this new support was less of a wave and more like a ripple. Funding to explicitly benefit immigrants and refugees only grew from 1.3% of all foundation funding in 2011-2015 to 1.8% in 2016-2020. Similarly, money for movement advocacy and organizing never exceeded 0.4% of U.S. foundation funding in any of these years. Given that 14% of the people living in the United States were born abroad, this continued underfunding is striking, and a missed opportunity.

The ripple may be fading as well. These new resources peaked in 2017 and 2018, often via one-time special grants, in the years immediately following Trump’s election. According to available data, annual funding for immigrants and refugees and for the pro-immigrant and pro-refugee movement decreased in 2019 and 2020. Anecdotally, that trend appears to have continued in the years since. The exceptions NCRP has seen as of publishing appear to mostly come from COVID-19 relief funds – crucial and necessary, but also time-limited.

Finally, this growth did not keep pace with foundations’ own wealth. Total foundation grantmaking in the United States quadrupled over the last 10 years – a reflection of growing wealth accumulation for the richest people and institutions across America.

Put another way: Even as grantmakers have gotten richer, the pro-immigrant and pro-refugee movement’s share of total foundation funding is actually smaller today than it was a decade ago.

The Shifting Funding Landscape

Who are the biggest players in pro-immigrant, pro-refugee movement funding after 2016?

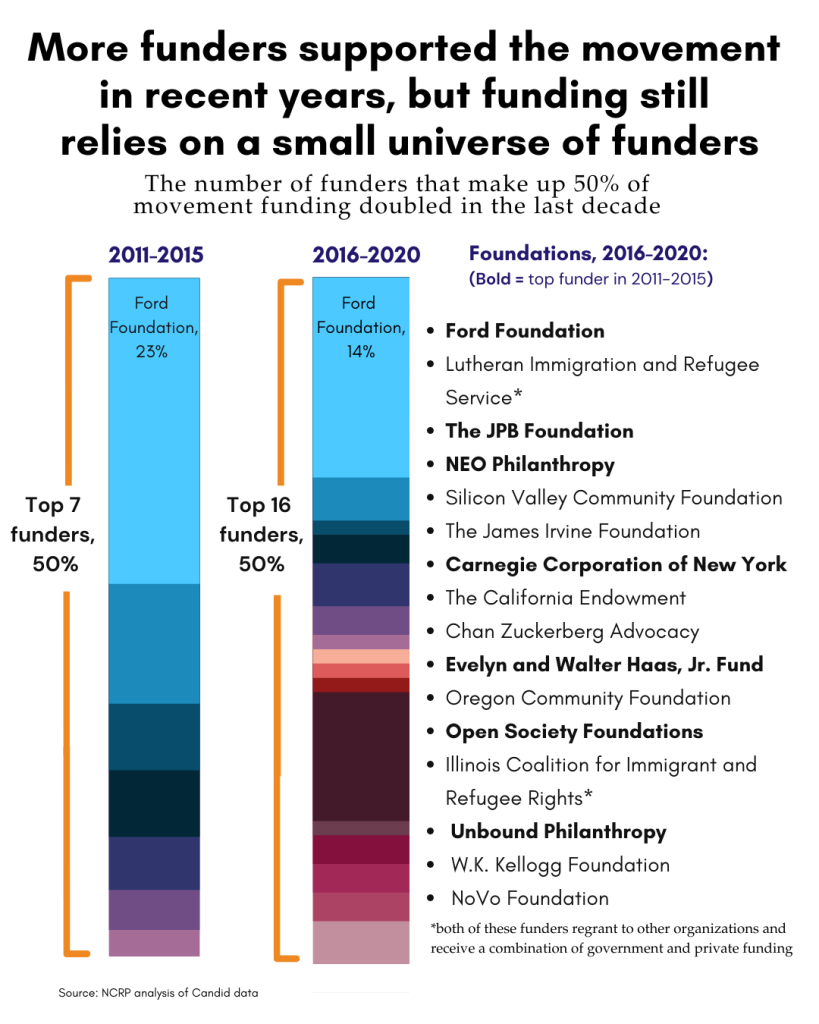
The Ford Foundation is still consistently the largest funder of the movement. But as more funders join in, Ford Foundation’s share of the movement’s grants has decreased from roughly 25% to 10% in recent years.

This is a good thing. In the last 5 years, funding for the movement became slightly less top-heavy, with 16 funders making up half of all movement funding rather than just 7. In fact, the total number of funders who have given at least once to the movement grew from around 500 in 2011 to about 2,500 at the funding peak in 2018, mostly through small, scattered grants.

Movement leaders should be proud of their own leadership in making this happen, speaking truth to philanthropy and making bolder asks that reflect their needs. Philanthropic groups like GCIR, Four Freedoms Fund, and Hispanics in Philanthropy stepped up, too. These networks recruited more funders to give consistently to the movement, and they even set up innovative funds of their own, often prioritizing undocumented, Black, and indigenous migrant communities transnationally. Immigrant leaders within foundations have also begun to create important political homes in the sector, like the Undocumented in Philanthropy Network.

But the movement’s ongoing reliance on a relative handful of foundations creates instability as well as increased pressure on the top funders. If just one major foundation shifts its priorities, as we’ve seen in other movements before, it affects the entire ecosystem.

And because big funders tend to give bigger grants to better-known groups, movement funding is also top-heavy. At the movement’s funding peak in the years after Trump’s election, the top 50 movement recipients received over half of the funds. National organizations focused on federal policy and litigation still dominate that list as well.

Because this is an underfunded movement, many of the biggest groups are still relatively small for the scope of their work. This includes policy, communications, and litigation groups, whose work is important and deserves much more funding. But community-accountable power-building groups – particularly at the local level – consistently shoulder the most critical work, and they are the most under-resourced.

Every federal policy push, narrative campaign, and legal strategy ultimately relies on grassroots community-driven groups to build the power and political will for change. And while power-building groups’ share of the movement funding pie did increase slightly in recent years, they only made up 40% of the top 20 recipients between 2016-2020.

Furthermore, only a handful of these top recipients were regional or local, rather than national groups.

What Must Funders Do

By following these asks from immigrant and refugee movement leaders, foundations can begin to heal their past harm and build a better world.

They’ll become much more effective grantmakers, too:

1.  Model Equity: As you resource the movement, give special care to prioritize groups led by Black, AAPI, indigenous, LGBTQ, undocumented immigrants, and refugees and asylum seekers, especially local movement-building groups in underfunded regions. Simplify your reporting and application requirements, recognizing that people responding to crises may have more pressing deadlines.

2.  Accountability: Make your money accessible and your grantmaking criteria, timeline and decision-making transparent. Partner with trusted, movement-accountable funder intermediaries if this alleviates barriers for you to get resources to the field.

3.  Build Long-term Power: Give flexible, long-term c3, c4 and fiscal sponsor support. Groups will need this money for services, defense and organizing long before and after the elections, you follow and the headlines you see. Consider ways you can build and cede power by transferring physical assets and investing your endowment in ways that support resource ownership by immigrant communities.

4.  Fund Sustainability: Create space for leaders to prioritize their own mental health and begin healing from ongoing trauma. Share power by giving resources that allow communities to build accessible spaces themselves, from translation to privacy and childcare.

5.  Organize! Organize your board, community, and funder networks. Use your public voice to wield your institutional and individual power to amplify local movement calls to action, especially when they’re not in the headlines. Help your peers understand that migrant justice is core to your values and your mission, not a niche to be tossed aside.
 

Methodology

The most recent available data for this analysis ends in 2020. At NCRP, we know that a lot has happened in the years since and that philanthropy has shifted in ways both good and bad, which can’t be reflected in this data. However, based on what we hear from frontline groups on the ground and folks in the philanthropic sector, we believe the broader trends we name here remain true today.

DEFINITIONS [1]

Local funding refers to funding from foundations to recipient organizations located in and serving the population of the same state or region (e.g., an Alabama-based funder giving to an Alabama-based organization).

Population funding refers to grants that explicitly benefit immigrants, refugees, and asylum seekers in the United States.

Per capita funding refers to foundation grant dollars given per immigrant living in the region. Immigrant community figures are sourced from 2020 American Community Survey data filtered for each state, using the “foreign-born population” numbers. Because immigrants are chronically undercounted in the census, the per capita figures shared in this analysis are likely an overcount.

Pro-immigrant and pro-refugee movement groups refer to organizations dedicated to building power and honoring the civil and human rights of immigrants and refugees in the United States. Organizational activities include but are not limited to state-based advocacy campaigns, civic engagement, community organizing and grassroots leadership development. For more information on movement groups and the pro-immigrant movement, read NCRP’s 2019 brief, the State of Foundation Funding for the Pro-Immigrant Movement.

MOVEMENT FUNDING DATA [2]

Grantmaking data

NCRP derived foundation grantmaking figures for the pro-immigrant and pro-refugee movement by analyzing Candid data, beginning with grants under Candid’s “immigrant rights” subject code and adding all grants to over 150 known pro-immigrant organizations to create a broad dataset of pro-immigrant and pro-refugee grants. There is no “pro-immigrant movement” checkbox on the Form 990, nor is there a pro-immigrant movement code in Candid, so it is likely that some grants were left out of the data, but this is our best approximation of grant data for the ecosystem of organizations in the movement.

The dataset reflects grantmaking data from 2011-2020 to include a broad view of grantmaking for the pro-immigrant and pro-refugee movement over the last decade. Grantmaking data from 2020 is not complete because data are still being collected by Candid, but we are confident that the available data are representative of total funding for the year.

In addition, because of changes to Candid’s data collection for its database, grantmaking figures prior to 2014 capture a relatively smaller slice of total foundation funding than Candid grantmaking figures post-2014. Beginning in data year 2015, the scope of Candid’s tracking of grantmaking data expands, increasing the total number of grants available in Candid’s database. Because of this change, it is difficult to separate with 100% certainty the increase in funding for the pro-immigrant and refugee movement over these years from the growing size of the sector and the growing slice of the sector tracked in Candid’s systems, especially for grants data prior to 2015.

In NCRP’s analysis, the 2015 scope change is most noticeable for two categories of grantmakers: public charities and community foundations. After 2015, the number of public charities and community foundations included in the dataset giving to the pro-immigrant and refugee movement per year was consistently higher than 2014 and prior. For example, the number of public charities in our dataset increased six-fold from 33 in 2014 to 182 in 2015, and the number of community foundations increased from 44 in 2014 to 77 in 2015. It is important to note that this increase in the number of grantmakers was not significant for independent foundations and family foundations during this time, which make up the majority of funding for the movement across all years of data.

NCRP’s analysis includes percentages of totals to provide a perspective on the changing sector that is not affected by the always-growing scope of Candid’s data collection.

Coding Funds and Movement Roles

NCRP researchers coded grant recipients based on a list of qualitative characteristics: Whether the organization provides direct services, whether the organization is a network, the geographic scope of the organization’s work, and the primary and secondary movement roles performed by the organization.

Movement roles were determined based on NCRP’s interpretation and application of the Ayni Institute’s movement ecology framework, which can be found in the 2018 report Funding Social Movements, by Paul Engler, Sophie Lasoff and Carlos Saavedra.

Funding data for the movement does not include:

•  Intermediaries as recipients of funding. Intermediary grantmakers (e.g., Borealis, New Venture Fund) receive funding from other foundations to regrant to movement organizations – their data as a recipient of funds from foundations was removed from the analysis, and only their grantmaking data are included.

•  College scholarship grants: In some cases, grants for college scholarships, or scholarships specifically for DACA recipients, were coded as “immigrant rights” in Candid. While these grants are considered as benefitting immigrant and refugee populations, we did not include them as power-building grants for the pro-immigrant and pro-refugee movement, so these grants are excluded from the analysis.

•  COVID-19/Coronavirus pandemic relief grants: Grants data were excluded from movement funding data if: 1) the recipient organization does not primarily focus on immigrants or power-building for immigrant rights and 2) the grant itself did not focus on immigrants or have a power-building element to it (e.g., a grant description that only says “COVID-19 emergency response,” “coronavirus relief,’ or “cash assistance to individuals affected by COVID-19″). COVID-19 related grants were kept in the dataset, even if the recipient was not primarily an immigrant-serving organization or power-building organizing group, if the grant was intended specifically for immigrants and refugees based on the grant description or there was a power-building aspect to the grant (e.g., “For operating support for meeting critical COVID-19 related needs, “emergency response grants for programs and services to meet crucial needs.”)

•  Philanthropic funding in Puerto Rico, the U.S. Virgin Islands and other U.S. territories: Candid data for these regions is unfortunately limited. The territories’ legal status also contributes to some confusion when it comes to how foundations describe funding for local immigrant populations. For these reasons, they have been excluded from this analysis.

STATES INCLUDED IN EACH REGIONAL BREAKDOWN

MidwestPacific NorthwestMountain WestNortheastSouthSouthwest
Iowa
Oregon
Colorado
Connecticut
Alabama
Arizona
IllinoisWashingtonIdahoDelawareArkansasNew Mexico
IndianaMontanaDistrict of ColumbiaFloridaTexas
KansasNevada
MassachusettsGeorgia
MichiganUtahMarylandKentucky
MinnesotaWyomingMaineLouisiana
MissouriNew HampshireMississippi
North DakotaNew JerseyNorth Carolina
NebraskaPennsylvaniaOklahoma
OhioRhode IslandOklahoma
South DakotaVermontSouth Carolina
WisconsinTennessee
Virginia
West Virginia

Alaska and Hawaii are not included in specific regional analyses, but data for these two states is included in the national data analysis. Data specific to Alaska and Hawaii is also included in the Appendix.

The grantmaking data for California and New York are only included as state-level data instead of including them as part of regional data. The concentration of foundations and nonprofits located in both states means that the grantmaking totals for each state would skew the regional analyses, so data for New York and California are treated as their own “regions.”

Additional state-by-state analysis is available in the Appendix.

FUNDING FOR UNDERFUNDED COMMUNITIES 

We also examined foundation funding to pro-immigrant and pro-refugee movement groups that focus primarily on underfunded communities even within the immigrant diaspora. For this additional analysis, we examined grant data for 501c3 groups whose primary focus was Black migrant communities, AAPI migrant communities, LGBTQ migrant communities, indigenous migrant communities, and refugees.

The organizations for each respective underfunded communities whose grants were included were identified through 1) self-identification in organizations’ public statements, name, and mission and 2) external review from movement leaders.

The underfunded communities that are highlighted in this research are not mutually exclusive communities, and the data are also not mutually exclusive.


ENDNOTES

1 As defined originally in the methodology for our 2020 interactive dashboard

2 First paragraph adapted from the definitions found in the 2019 State of Foundation Funding infographic methodology

Acknowledgments

Thank you to all the organizations who lent their visuals for this report, including Church World Service, the National Korean American Service & Education Consortium (NAKASEC), the Undocublack Network, Comunidades Indigenas en Liderazgo (Cielo), and Organizacion Latina de Trans en Texas (OLTT).

Thank you to all NCRP staff and allies who provided valuable feedback on every aspect of this report up until publishing and to Kait Grable Gonzalez and Alex Hudson at M+R for all their help in getting this report out onto social media.

NCRP would also like to thank the following people for sharing their time and insight early in the research process. Your wisdom made this report so much stronger.

Basma Alawee
Greisa Martínez Rosas
Lian Cheun
Ola Osaze
Sheila Bapat
Xiomara Corpeno

Finally, NCRP cannot do our work without the wisdom, strength, and organizing of our nonprofit members. We especially want to thank the following members for their ongoing commitments in the pro-immigrant, pro-refugee movement:

Advancement Project
African Communities Together, Inc.
Alabama Coalition for Immigrant Justice
Alliance for Youth Organizing
Capital & Main
Catalyst California (formerly Advancement Project California)
Coalition for Humane Immigrant Rights (CHIRLA)
Community Change
Ethnic Minorities of Burma Advocacy and Resource Center
Florida Immigrant Coalition Inc
Gamaliel Foundation
Green 2.0
IAF Northwest
Jobs with Justice Education Fund
Khmer Girls in Action
LA Voice
Legal Aid Justice Center
Louisiana Organization for Refugees and Immigrants
National Partnership for New Americans
Refugee Congress
SisterReach
Southeast Immigrant Rights Network
Tennessee Justice Center
United Stateless
United We Dream Network
Virginia Coalition for Immigrant Rights
Virginia Organizing
Welcoming America

Written principally by NCRP staff members Jennifer Amuzie, Ben Barge, Spencer Ozer, and Stephanie Peng, with additional editing by Elbert Garcia and Timi Gerson. Data collection and analysis conducted by Spencer Ozer and Stephanie Peng. 

 All graphics were designed in-house by NCRP’s Research team of Katherine Ponce, Spencer Ozer, Stephanie Peng, and Ryan Schlegel.

Professional copyediting services provided by Elizabeth Rinehart. 

Appendix A

Top Funders for the Pro-Immigrant, Pro-Refugee Movement, 2011-2015

Foundation Name
% share of total grantmaking for the movement,
2011-2015
1. Ford Foundation
23%
2. NEO Philanthropy
9%
3. Open Society Foundations
5%
4. Carnegie Corporation of New York
5%
5. The JPB Foundation
4%
6 Evelyn and Walter Haas, Jr. Fund
3%
7 Unbound Philanthropy
2%
Total grantmaking for the movement, 2011-2015: $649,064,760

Top Funders for the Pro-Immigrant, Pro-Refugee Movement, 2016-2020

Foundation Name
% share of total grantmaking for the movement,
2016-2020
1. Ford Foundation
14%
2. Lutheran Immigration and Refugee Service*
9%
3. The JPB Foundation
3.3%
4. NEO Philanthropy
3.2%
5. Silicon Valley Community Foundation
3.2%
6. The James Irvine Foundation
2%
7. Carnegie Corporation of New York
2%
8. The California Endowment

1.8%


9. Chan Zuckerberg Initiative
1.7%
10. Evelyn and Walter Haas, Jr. Fund
1.7%
11. Oregon Community Foundation
1.5%
12 Open Society Foundations
1.5%

13. Illinois Coalition for Immigrant and Refugee Rights*
1.4%

14. Unbound Philanthropy
1.4%

15. W.K. Kellogg Foundation
1.3%
16 NoVo Foundation
1%
Total grantmaking for the movement, 2016-2020: $1,408,122,102

*Lutheran Immigration and Refugee Service and Illinois Coalition for Immigrant and Refugee Rights are not grantmakers themselves. They regrant funding that they receive from a combination of government funding and foundations to local community organizations.

Appendix B: State-by-State Comparisons

This is a state-by-state comparison of foundation funding benefitting immigrants and refugees and benefitting the pro-immigrant and pro-refugee movement, with funding from all U.S. foundations and from foundations based in the same state as the recipient. Each comparison is a per capita analysis that shows the amount of grant dollars for each category per immigrant living in the region.

*Total funding for each state or region may be overestimated because the data may include funding to national organizations located in the state or region that serve other states and regions.

State 2017-2020, Population funding per capita (from all funders) 2017-2020, Population funding per capita (from in-state funders only)  2017-2020, Movement funding per capita (from all funders)  2017-2020, Movement funding per capita (from in-state funders only)
AK $35 $17 $2 $1
AL $21 $5 $17 $6
AR $26 $10 $8 $1
AZ $38 $11 $15 $1
CA $84 $55 $30 $16
CO $59 $34 $24 $10
CT $24 $12 $5 $2
DC $5,338 $286 $1,765 $95
DE $14 $12 $1 $1
FL $19 $10 $6 $2
GA $34 $11 $15 $1
HI $12 $9 $0.41 $0.10
IA $46 $22 $16 $5
ID $48 $27 $410 $0.12
IL $107 $66 $41 $24
IN $36 $21 $21 $9
KS $59 $36 $2 $0.49
KY $120 $27 $67 $1
LA $43 $29 $41 $2
MA $118 $68 $21 $9
MD $54 $12 $31 $5
ME $333 $183 $70 $40
MI $110 $49 $60 $5
MN $245 $136 $20 $8
MO $69 $26 $3 $1
MS $27 $4 $5 $0.32
MT $34 $13 $5 $0
NC $31 $13 $9 $1
ND $54 $12 $29 $0
NE $238 $185 $66 $52
NH $152 $47 $5 $4
NJ $13 $6 $1 $1
NM $102 $18 $35 $7
NV $5 $0.45 $1 $0.03
NY $153 $91 $48 $33
OH $51 $35 $20 $18
OK $8 $7 $1 $1
OR $187 $135 $73 $66
PA $67 $42 $37 $8
RI $137 $33 $2 $0.39
SC $20 $2 $5 $1
SD $28 $5 $26 $1
TN $76 $28 $17 $6
TX $32 $14 $14 $3
UT $56 $23 $3 $1
VA $66 $10 $22 $1
VT $72 $17 $31 $4
WA $59 $41 $28 $20
WI $54 $29 $13 $2
WV $8 $5 $0.05 $0
WY $88 $59 $7 $7